
61%
61%
more efficiency
more efficiency
more efficiency
4
4
Weeks
Weeks
Weeks
55
55
Clients tested
Clients tested
Clients tested
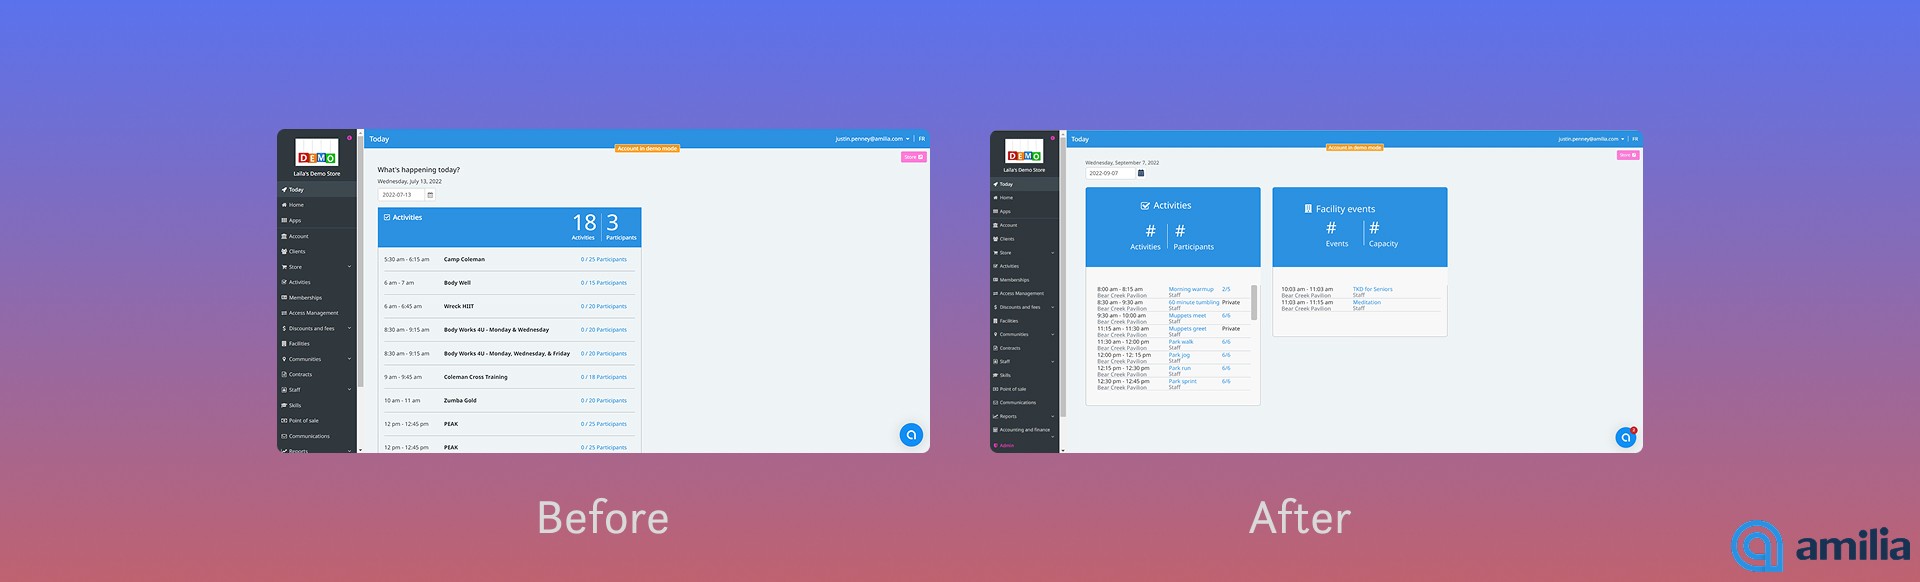
A dashboard needed more information, research told us what to add, I designed how to display it.
B2B e-commerce and reservations SaaS
Amilia is a SaaS reservation tool for parks, recreation facilities, and small businesses. Amilia serves about 1200 customer organizations across North America. The team added this dashboard page so clients would have an easy overview of activities. Customers had begun complaining that other important information they expected to see was missing from the page.
I led UX research to uncover any additional unmet needs for the page, and make sure we were solving the right problem. I then conducted a feasibility and prioritization workshop with product and engineering, to select high-value improvements. From there, I designed working prototypes and conducted usability testing, presenting my findings for Sprint inclusion.
My design solution resulted in a 61% decrease in time-on-task for users finding the information they needed.
Amilia is a SaaS reservation tool for parks, recreation facilities, and small businesses. Amilia serves about 1200 customer organizations across North America. The team added this dashboard page so clients would have an easy overview of activities. Customers had begun complaining that other important information they expected to see was missing from the page.
I led UX research to uncover any additional unmet needs for the page, and make sure we were solving the right problem. I then conducted a feasibility and prioritization workshop with product and engineering, to select high-value improvements. From there, I designed working prototypes and conducted usability testing, presenting my findings for Sprint inclusion.
My design solution resulted in a 61% decrease in time-on-task for users finding the information they needed.
Team
PM, 6 developers, UX Researcher (me), UX Designer (me)
PM, 6 developers, UX Researcher (me), UX Designer (me)
Platforms
Web
Tools
Figma, NativeForms, Useberry, Intercom
Outcomes
Survey data
Feasibility data
Priority matrix
Prototype
61% task completion
MVP shipped
Survey data
Feasibility data
Priority matrix
Prototype
61% task completion
MVP shipped
Challenge
The today page was missing information users needed for daily operations.
This page had been built during an "Innovation day" without considering the use case. Users had come to rely on it as a go-to source for their daily operations. Because of its heavy usage, many support tickets had come in asking for the page to include information clients would find more helpful.
Before the redesign, the page listed only one kind of site information: Activities (scheduled recurring events). Now that the platform allowed booking of private lessons and rentals, this information needed to be easy-to-find for org administrators.
This page had been built during an "Innovation day" without considering the use case. Users had come to rely on it as a go-to source for their daily operations. Because of its heavy usage, many support tickets had come in asking for the page to include information clients would find more helpful.
Before the redesign, the page listed only one kind of site information: Activities (scheduled recurring events). Now that the platform allowed booking of private lessons and rentals, this information needed to be easy-to-find for org administrators.
Goals
Go beyond the support tickets to solve the right problem and deliver a valuable MVP.
To address this challenge and make sure we uncover any other unmet needs, I ran a survey to get the Voice of the Customer.
I worked with the PM and devs to prioritize the data into work for the MVP.
I designed and tested 2 versions of a solution on internal stakeholders.
The project was put on hold due to company priority changes.
Once work resumed, I tested the designs on real-world users, validating that the needs were met and value delivered.
To address this challenge and make sure we uncover any other unmet needs, I ran a survey to get the Voice of the Customer.
I worked with the PM and devs to prioritize the data into work for the MVP.
I designed and tested 2 versions of a solution on internal stakeholders.
The project was put on hold due to company priority changes.
Once work resumed, I tested the designs on real-world users, validating that the needs were met and value delivered.
Solutions
An MVP that delivers, information that users need.
With the MVP requirements from the feasibility workshop, I created two designs and tested them side-by-side. Internal stakeholder testing was unanimous for one version, but we didn't have time to conduct usability testing on real users.
Company priority shifted during the course of this work, and I had to pare down the MVP once work resumed.
I recommend the two-card design for ease of implementation and because of recognizability, and it was put into production.
I ran a usability test and the testing validated the design choice as the better solution. Efficiency of information finding and navigation was 61% better in the selected design!
With the MVP requirements from the feasibility workshop, I created two designs and tested them side-by-side. Internal stakeholder testing was unanimous for one version, but we didn't have time to conduct usability testing on real users.
Company priority shifted during the course of this work, and I had to pare down the MVP once work resumed.
I recommend the two-card design for ease of implementation and because of recognizability, and it was put into production.
I ran a usability test and the testing validated the design choice as the better solution. Efficiency of information finding and navigation was 61% better in the selected design!
Design highlights:
Design highlights:
Verified needs
Customer support tickets were initially the only source of user data. I ran an on-page survey to uncover any additional unmet needs.
Customer support tickets were initially the only source of user data. I ran an on-page survey to uncover any additional unmet needs.
User Research
Tools:
Intercom
NativeForms
Intercom
NativeForms
Methodology:
Popup banner with survey link
Respondents: 55 clients
Popup banner with survey link
Respondents: 55 clients
Priority and feasibility workshop:
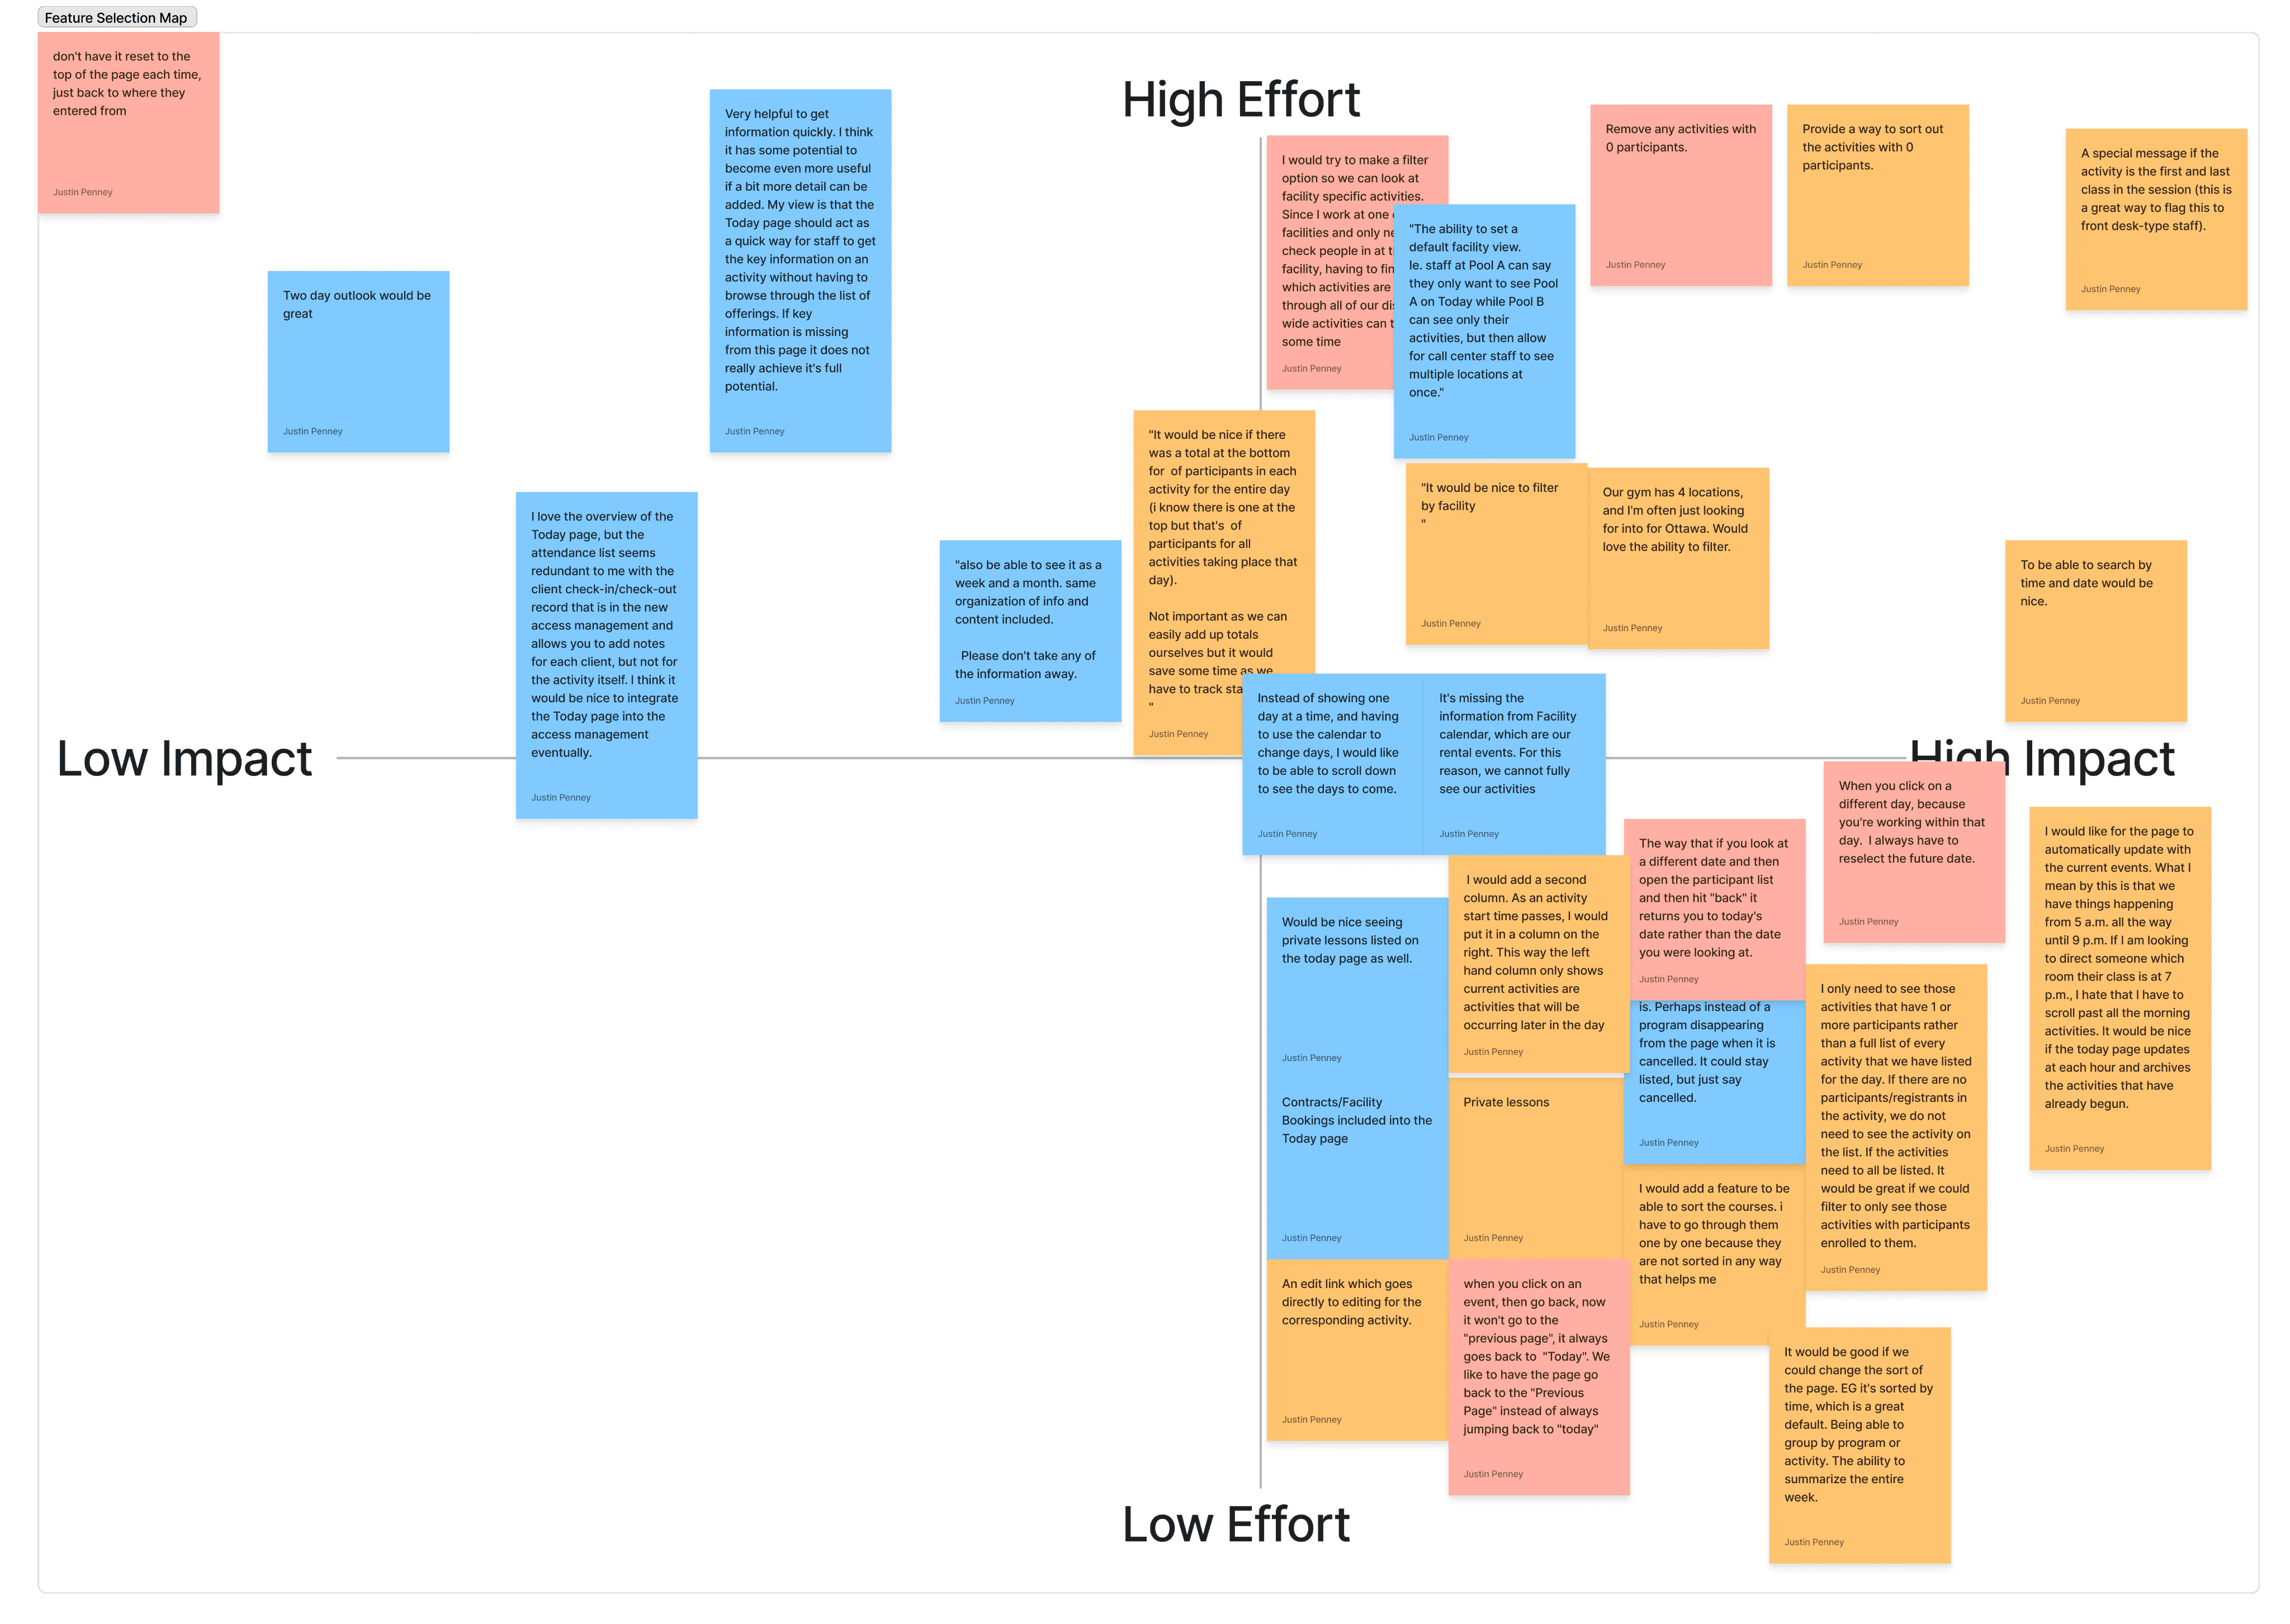
Turning VOC into action items:
I grouped results by sentiment
Then, I hosted a priority / feasibility workshop with engineering to decide what to include.
Our priority matrix informed the MVP design.
I grouped results by sentiment
Then, I hosted a priority / feasibility workshop with engineering to decide what to include.
Our priority matrix informed the MVP design.
MVP features
Ability to filter by facility
Ability to not see activities with 0 attendees
Add rental events and bookings
Searchable by day / time
Add private lessons
Make total events and total participants visible
Ability to filter by facility
Ability to not see activities with 0 attendees
Add rental events and bookings
Searchable by day / time
Add private lessons
Make total events and total participants visible
Design presentation to internal stakeholders
Mid-fidelity design presentation:
Well-received by internal stakeholders.
Opinions split over which version was better (Cards or Tabs).
Other priorities meant we didn't have time for external Usability testing, so I recommended the least-effort version (for the devs) shown below (2-Cards solution).
Well-received by internal stakeholders.
Opinions split over which version was better (Cards or Tabs).
Other priorities meant we didn't have time for external Usability testing, so I recommended the least-effort version (for the devs) shown below (2-Cards solution).
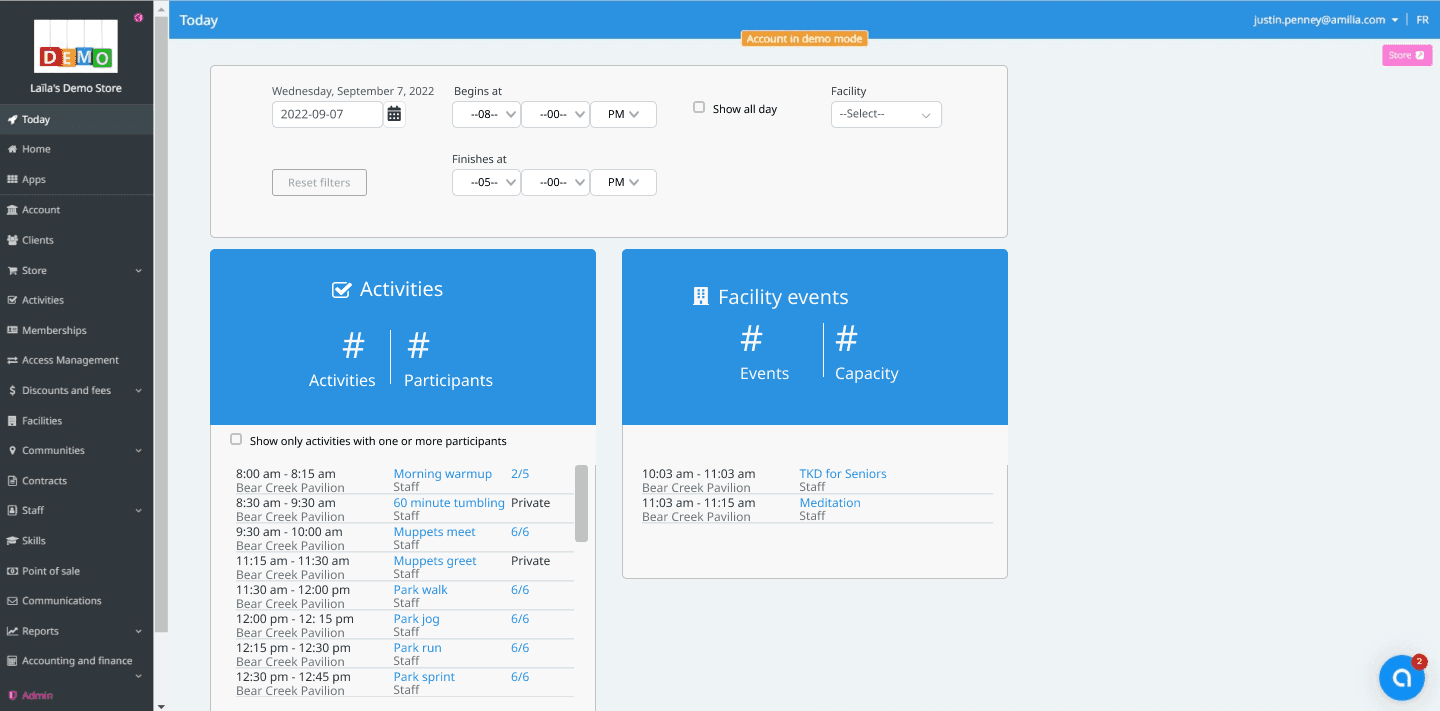
Cards version
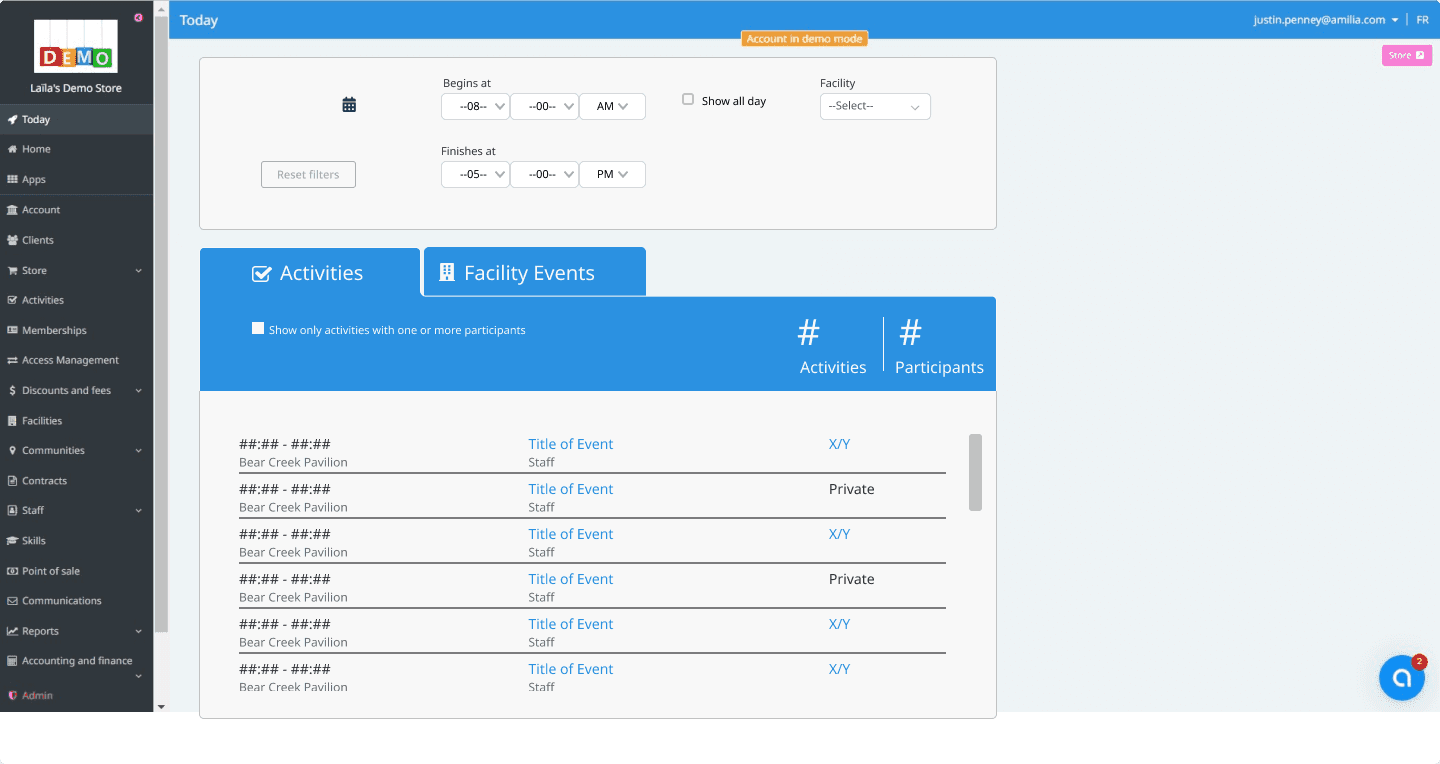
Tabs version
Scope change
We had to make the tough choices when bandwidth was limited, to still deliver outcomes users expect.
Work began roughly 4-5 months after the MVP due to turnover and leadership strategy shifts.
At that time developer resources were limited, and the filters were deprioritized.
Work began roughly 4-5 months after the MVP due to turnover and leadership strategy shifts.
At that time developer resources were limited, and the filters were deprioritized.
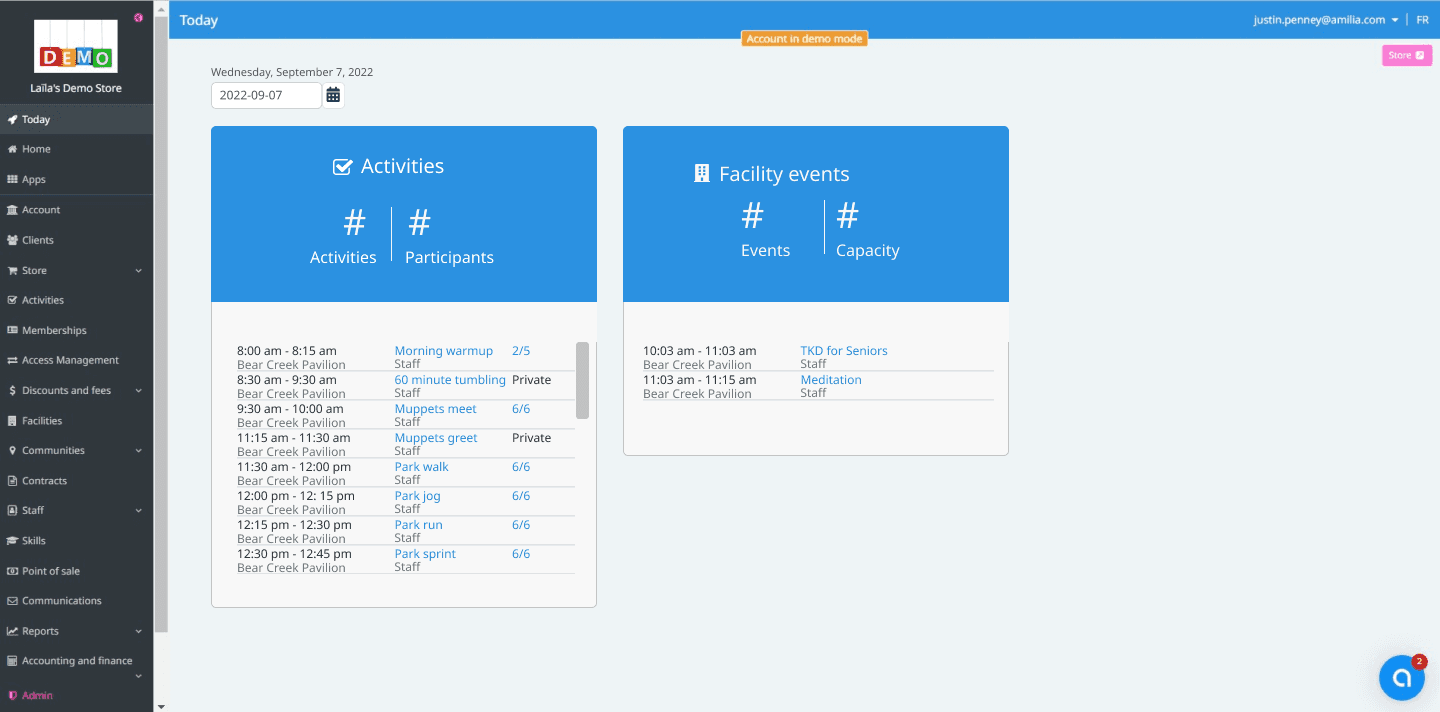
Final MVP version released to production
External usability test
Verifying that we made the right choice due to technical constraints, by testing on real-world users.
I had already tested the prototype internally using UseBerry coupled with Figma.
Internal stakeholders overwhelmingly preferred (81%) the tabs version.
I tested the prototype over 3 days on 23 real-world users through a prototype link in an Intercom banner.
Users were given 3 tasks to complete, with metrics of the results below.
Viewing the results below, Cards were a wild success!
I had already tested the prototype internally using UseBerry coupled with Figma.
Internal stakeholders overwhelmingly preferred (81%) the tabs version.
I tested the prototype over 3 days on 23 real-world users through a prototype link in an Intercom banner.
Users were given 3 tasks to complete, with metrics of the results below.
Viewing the results below, Cards were a wild success!

Reflections:
In an Agile environment, frequent shifts in priority are common.
When a new PM joins an ongoing project, I should present to them individually to ensure buy-in.
Prioritization and team bandwidth can limit the scope of solutions.
Maintaining detailed notes allows revisiting a project much later than initial kickoff.
In an Agile environment, frequent shifts in priority are common.
When a new PM joins an ongoing project, I should present to them individually to ensure buy-in.
Prioritization and team bandwidth can limit the scope of solutions.
Maintaining detailed notes allows revisiting a project much later than initial kickoff.
Justin Penney
Services
Strategic product design
Growth web design
Justin Penney
Services
Strategic product design
Growth web design